







Adherence and rate by route, every week

From sales forecast to truck.

How much freight you will need, by route and carrier, and what it costs you not to follow the plan.

Not every deviation is a mistake. Cauce shows you which ones need explaining and what the alternatives were.

MXN to be explained last week
$614.9K
Adherence to the suggested carrier
93.0%
Suggestion coverage: 93.0%

Example with fictional Grupo Pomarrosa data, as of November 4, 2026

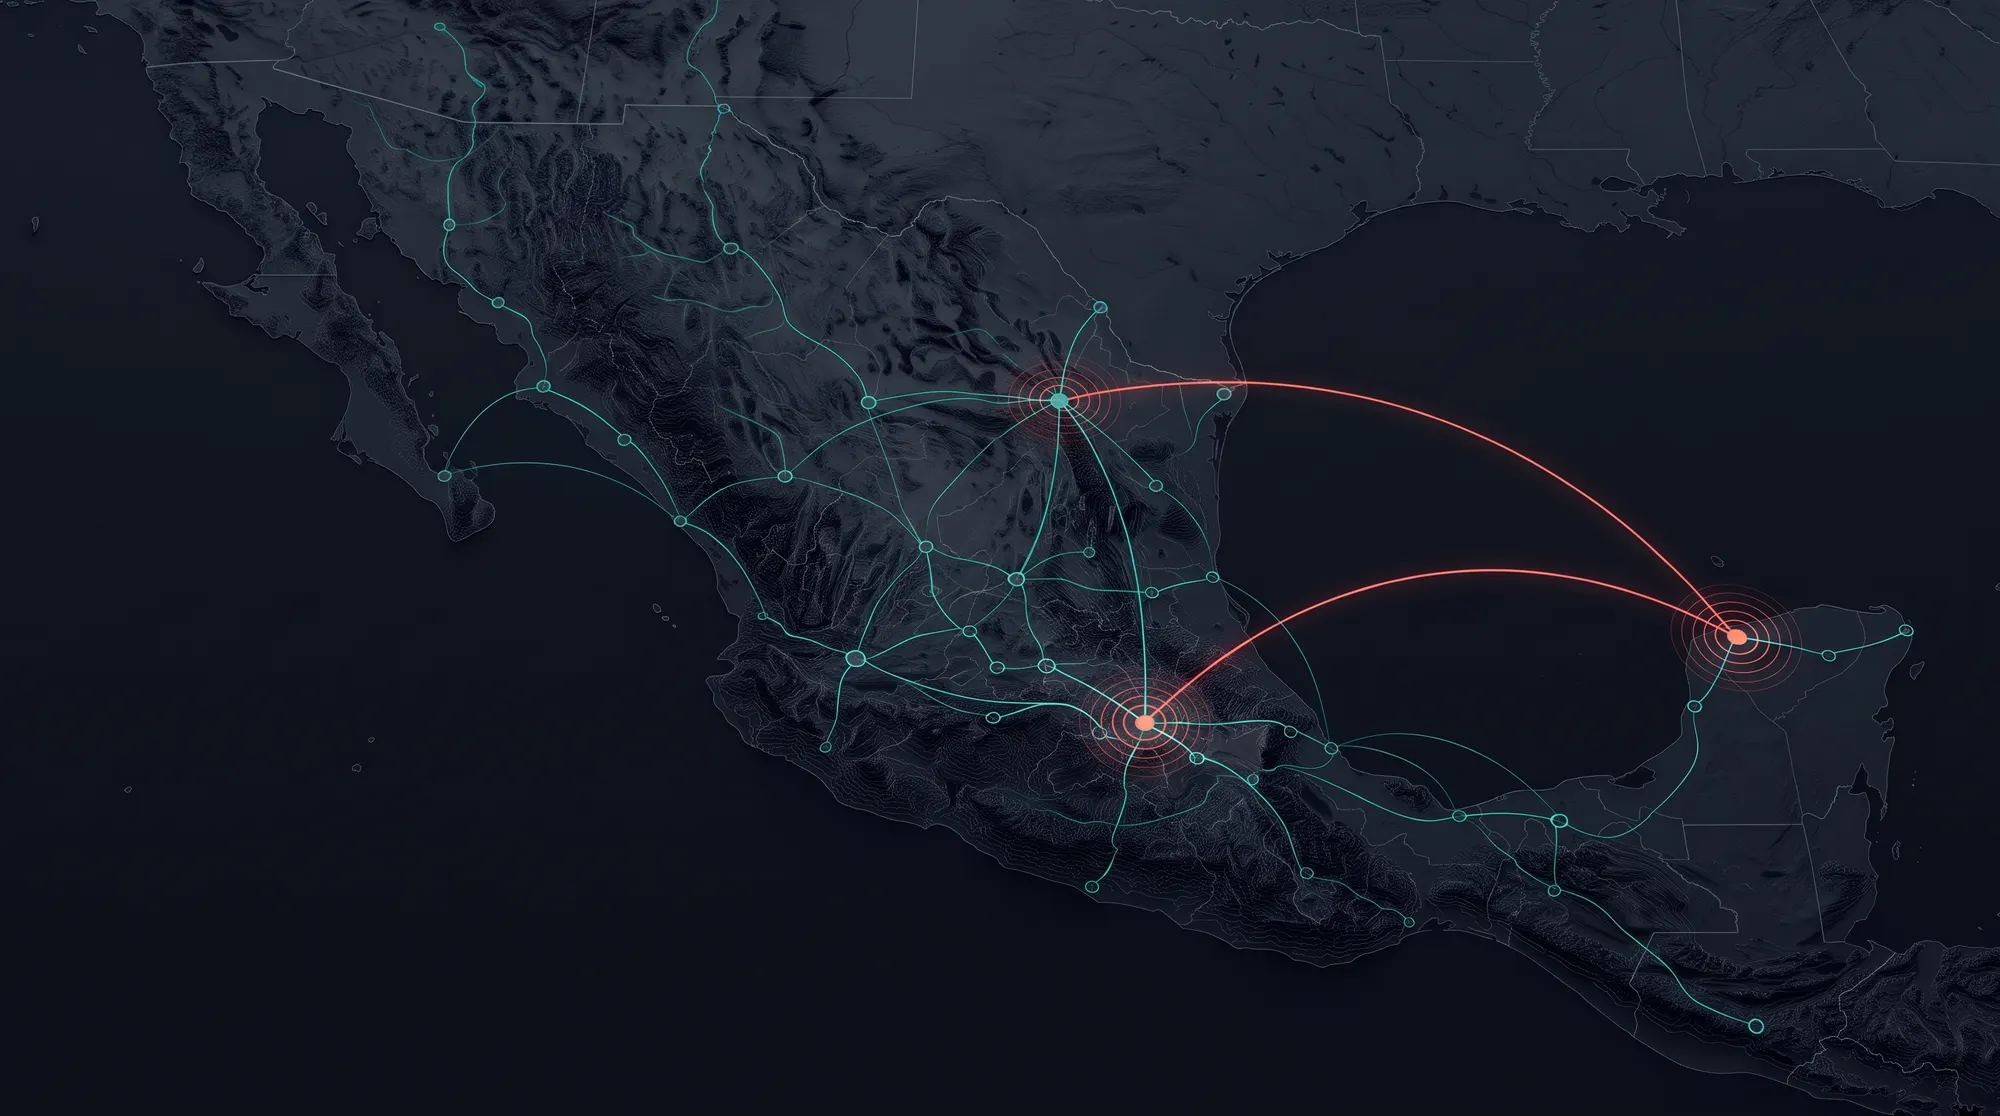
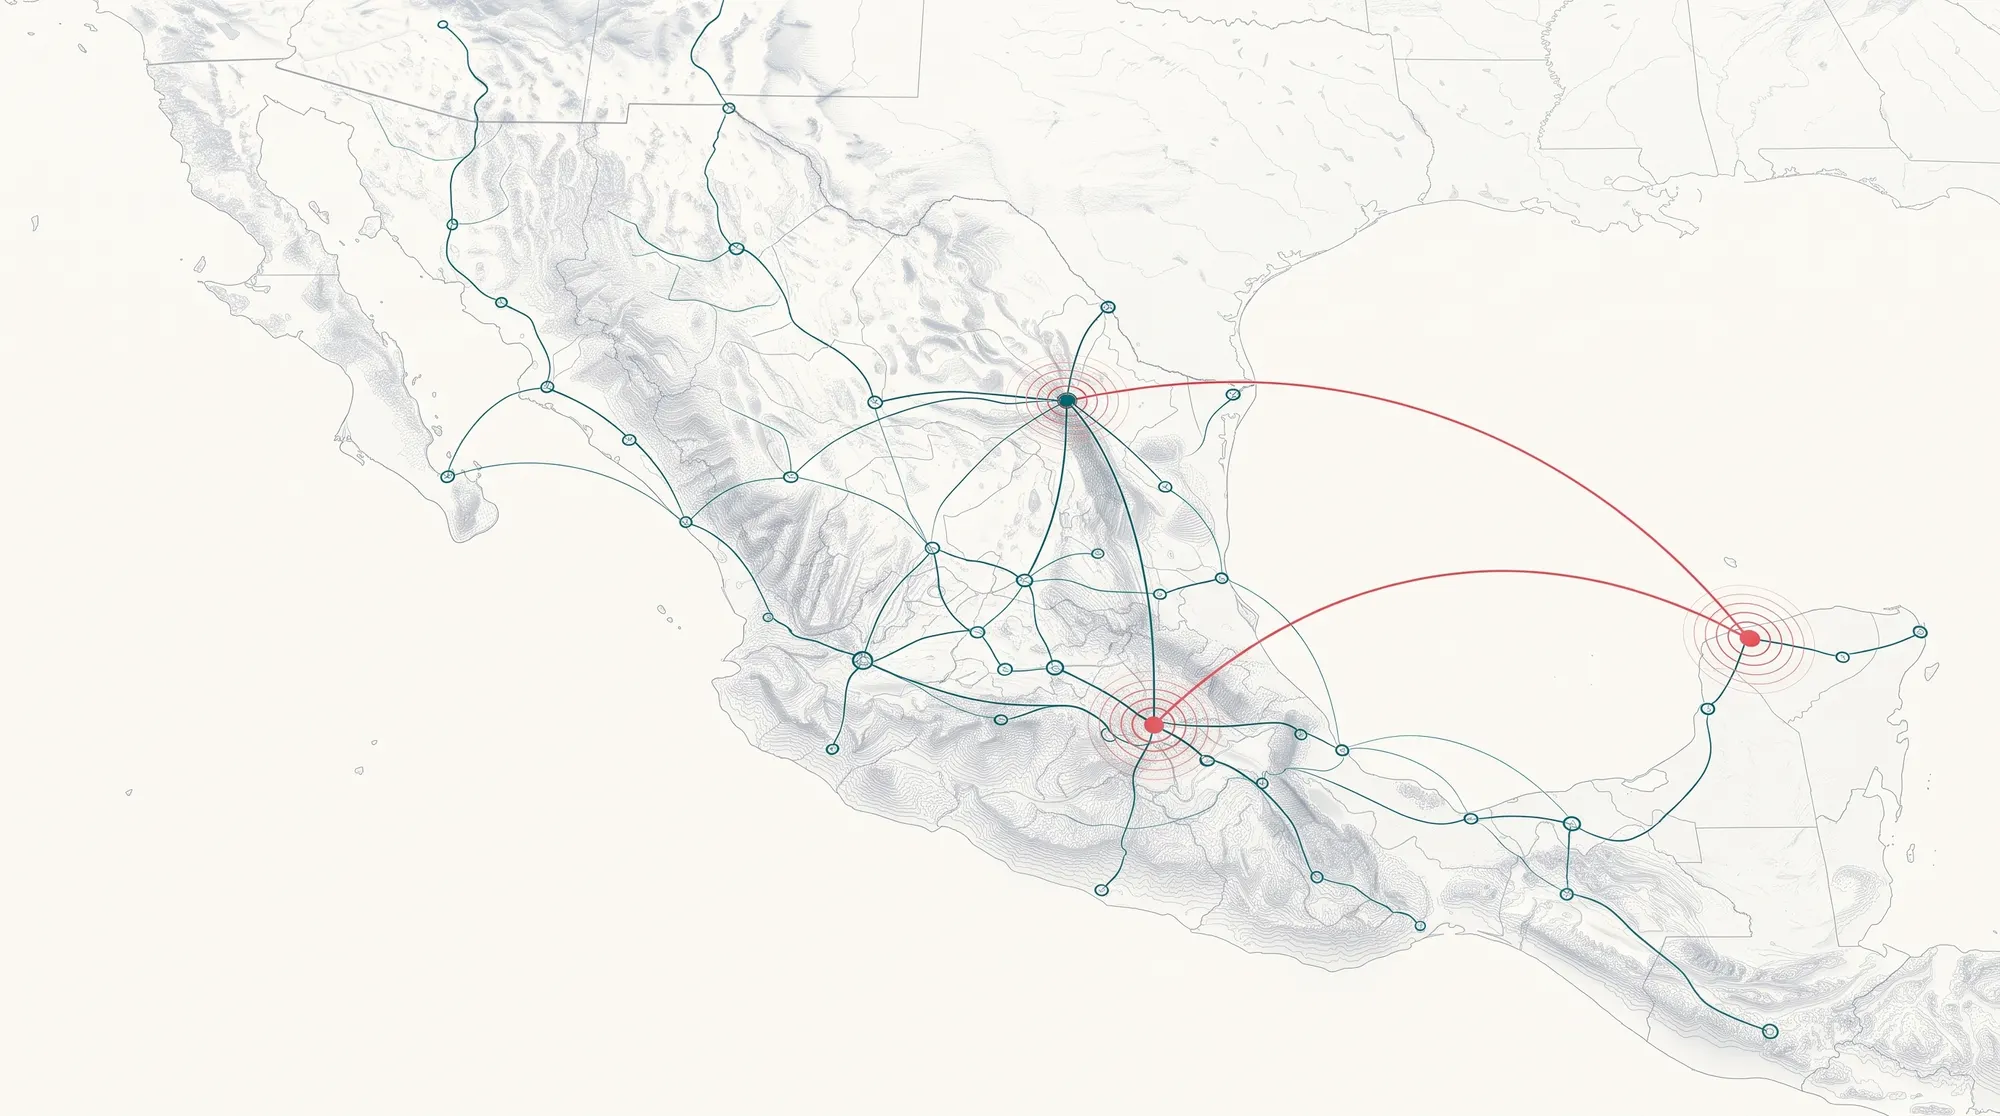
Map of Mexico with the last closed week's trips between plants and DCs of Grupo Pomarrosa, a fictional company.Map of Mexico with the last closed week's trips between plants and DCs of Grupo Pomarrosa, a fictional company.
Trips from the last closed week, plant to DC. Spot purchases are shown in coral.

One chain, from sale to truck

  1. Step 1

    Open the week

    Adherence to the suggested carrier and actual rate against target on every route, with the amount to be explained.

  2. Step 2

    Drill into the route that went off plan

    See each carrier change with its evidence: the suggestion, the carriers' responses and the reason, or no reason.

  3. Step 3

    Look at what's coming

    The forecast by SKU and DC turns into pallets, trips per route, and band usage. You see which day each one could run out.

  4. Step 4

    Test before you decide

    Hold or release units at month-end, ship today or wait, add capacity. The assistant explains the result.

What you see in the first meeting

Example with fictional datahistorical

Adherence and rate by route

Last week, Hub Central Ecatepec a CEDIS Monterrey averaged $24.2K per trip against a $18.1K target. On 33.3% of its trips with a suggestion, the suggested carrier was not used.

Open the dashboard
Example with fictional datahistorical

A deviation with a reason

At 08:40, the cheapest carriers had already declined or did not answer. The planner bought spot with a 17.3% premium: $4K over the suggestion, and a clear reason.

See the change and its evidence
Example with fictional dataforecast

The band that runs out

With this month's forecast, the Hub Central Ecatepec a CEDIS Guadalajara band could run out on day 11. 65 more trips would be needed: review them and confirm capacity and rate with the carrier.

See routes and bands

Your data stays in your space

  • Each customer has its own database schema, separate from all the others.
  • We only read. We do not write back to OTM or SAP.
  • We do not train or fine-tune any model on your data.
  • The forecast calculation runs on a Cauce-owned service, not a third-party model provider.
  • To answer, Anthropic receives your questions, the conversation history, and limited query results.
  • If you leave the Pilot, we delete your data and give you a receipt of what was deleted.

Pricing up front

Demo

Free

Fictional data, no signup.

Pilot

USD 15K, fixed price

90 days on your data, read only. One payment.

Platform

From USD 8K per month

For 25 users.

See pricing and what the Pilot includes

Open it as if it were Monday's meeting

A full workspace with Grupo Pomarrosa, a fictional company. No signup. Ask the assistant and it rearranges your dashboard.